Flood impact areas show the potential flood impact to the surrounding community. Flood impact areas are created using the Create Flood Impact Area tool, which intersects predefined inundation polygons with municipal or jurisdictional boundaries. The result is a series of flood impact areas for each potential flood level.
To determine the potential flood impact area, complete the following steps:
- Browse to the MapsandGeodatabase folder and open FloodPlanning.mxd.
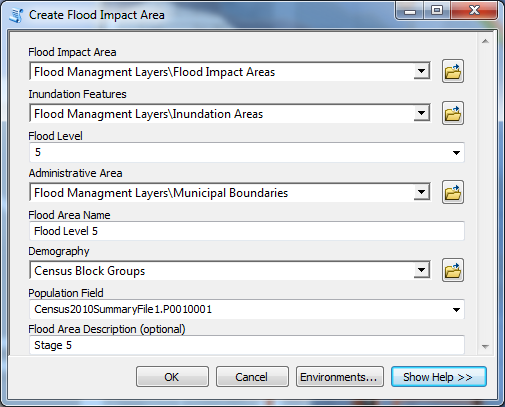
- Open the Create Flood Impact Area tool from the Flood Planning toolset, in the Local Government toolbox found at MapandGeodatabase\LocalGovernment.tbx.
- In the Flood Impact Area parameter, click the drop-down arrow and choose Flood Impact Areas layer.
- In the Inundation Features parameter, click the drop-down arrow and choose Inundation Areas layer.
- In the Flood Level parameter, click the drop-down arrow and choose 5.
- In the Administrative Area parameter, click the drop-down arrow and choose Municipal Boundaries layer.
- In the Flood Area Name parameter, type Flood Level 5 into the text box.
- In the Demography parameter, click the drop-down arrow and choose Census Block Groups layer.
- In the Population Field parameter, click the drop-down arrow and choose a field.
- In the Flood Area Description parameter, type Stage 5 into the text box.
- Click OK to run the tool.
Learn more about the Create Flood Impact Area tool parameters
The result of this tool is a new polygon feature added to the FloodImpactArea feature class. The flood impact areas are used by subsequent tools to identify the potential flood impact on the surrounding community and infrastructure.
- Repeat the process to create additional flood impact areas as necessary. Consider creating several impact areas for multiple flood levels in order to prepare the data completely. The Naperville sample dataset contains impact areas for 6-, 8-, and 10-foot flood levels.
Identify impacted features
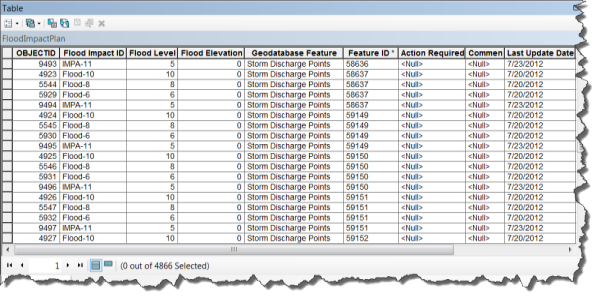
The Create Flood Impact Plan tool identifies features that may be impacted at each flood level by intersecting feature classes with the flood impact areas. The results are written to the FloodImpactPlan table.
To identify features within the potential flood impact area, complete the following steps:
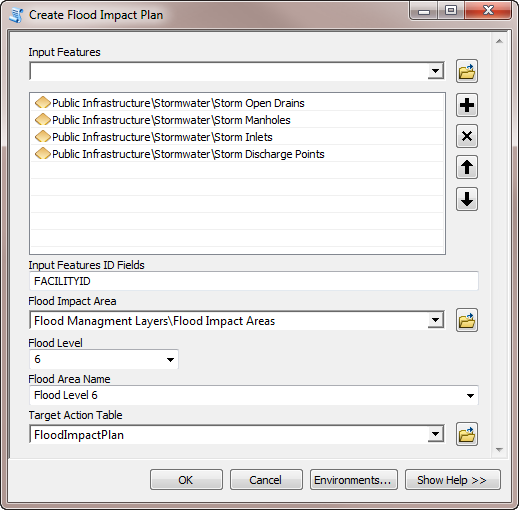
- Open the Create Flood Impact Plan tool from the Flood Planning toolset, in the Local Government toolbox found at MapandGeodatabase\LocalGovernment.tbx.
- In the Input Features parameter, browse to facility site points; locations of vulnerable populations; and infrastructure data such as storm water, sewer, and road features.
- In the Input Features ID Fields parameter, type in fields containing feature identifiers such as CENTERLINEID, FACILITYID, CONTACTID, NAME, and PARCELID.
- In the Flood Impact Area parameter, browse to the Flood Impact Areas feature class.
- In the Flood Level parameter, click the drop-down arrow and choose a flood level.
- In the Flood Area Name parameter, click the drop-down arrow and choose a flood level name.
- In the Target Action Table parameter, click the drop-down and choose a table to which the impacted features will be written.
- Click OK to run the tool.
Learn more about the Create Flood Impact Plan tool parameters
- Repeat this process for each flood level as necessary.
- Join the FloodImpactPlan table to each of the layers used as input for the Create Flood Impact Plan tool. The Feature ID field of the FloodImpactPlan table corresponds to the Facility Identifier field in the infrastructure feature class.
- Symbolize the impacted infrastructure by the flood level at which the features may be affected. This information is available in the attributes of the joined table and can be used to visualize the geographic patterns of the impacted infrastructure.