The ArcGIS Dashboards application can be used to visualize and summarize photo surveys as they are submitted. Photo surveys can then be monitored to view overall progress and determine if the property condition reported through the survey needs further attention.
The ArcGIS Dashboards application consumes maps that are accessible to named users in your ArcGIS Online organization. Create a Photo Survey map and share it with operations staff responsible for monitoring photo surveys. Operations staff can then access the configurations of the ArcGIS Dashboards applications on their desktop computers and tablet devices.
The steps below show you how to create a Photo Survey map and a dashboard for monitoring damage surveys.
Photo Survey map
To create an ArcGIS Online Photo Survey map, complete the following steps:
- Sign in to your ArcGIS Online organization.
-
Create a map used to monitor photo survey, by completing the following workflows:
- Choose a basemap.
- Add the PhotoSurvey layer to the map.
- Configure pop-ups for the PhotoSurvey layer.
- Save the map as Photo Survey Dashboard.
Photo Survey Dashboard
To create a Photo Survey Dashboard, complete the following steps:
- Open the ArcGIS Dashboards application.
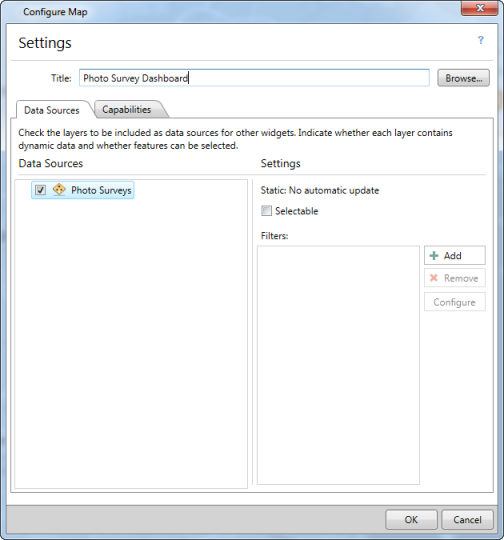
- Create a new single-display operation view and choose the Photo Survey Dashboard map.
- Select the Photo Surveys layer as a Data Source. Click OK
- Change the Layout by clicking Panel Settings > Layout > Thirds.
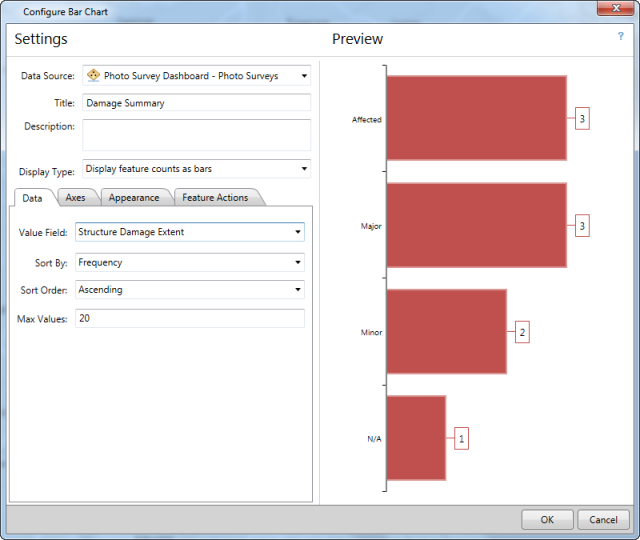
- Add a bar chart widget and choose Photo Survey Dashboard - Photo Surveys as the data source. Name the widget Damage Summary and change the Display Type to Display feature counts as bars.
- In the Data tab, set the Value Field to Structure Damage Extent. Adjust the Axes, Appearance, and Feature Actions to your preference.
- Add a bar chart widget and choose Photo Survey Dashboard - Photo Surveys as the data source. Name the widget Structure Type Summary and change the Display Type to Display feature counts as bars.
- In the Data tab, set the Value Field to Residential-Commercial. Adjust the Axes, Appearance, and Feature Actions to your preference.
- Add a bar chart widget and choose Photo Survey Dashboard - Photo Surveys as the data source. Name the widget Road Condition Summary and change the Display Type to Display feature counts as bars.
- In the Data tab, set the Value Field to Road Damage Extent. Adjust the Axes, Appearance, and Feature Actions to your preference.
- Add a new panel by clicking Panel Settings > Layout > Two Thirds Bottom.
- Add a summary widget and choose the Photo Survey Dashboard- Photo Surveys as the data source. Name the widget Number of Surveys and set the Display Type to Count.
- Click OK.
- Add a list widget and choose the Photo Survey Dashboard - Graffiti as the data source. Name the widget Reported Graffiti and check the Allow Filter check box.
- In the Data tab, set the Sort Field to DateTime.
- Click the Feature Display tab, and type Damage: in to the Title text box, then click on the Insert Field button and choose Structure Damage Extent {STRUCTDMGEXT}.
- In the Feature Display tab, change the Description to Custom, and define it with the following fields.
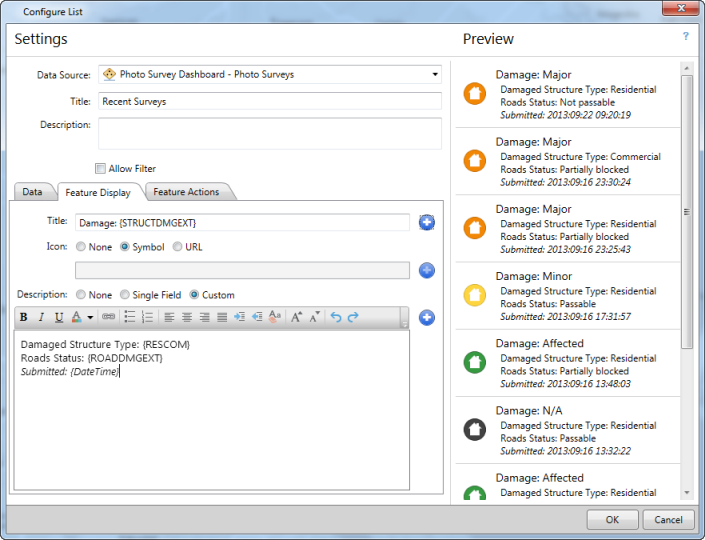
- Click the Feature Actions tab and enable Show pop-up, Highlight, Zoom to tools, then choose Highlight in the Double click drop-down.
- Click OK.
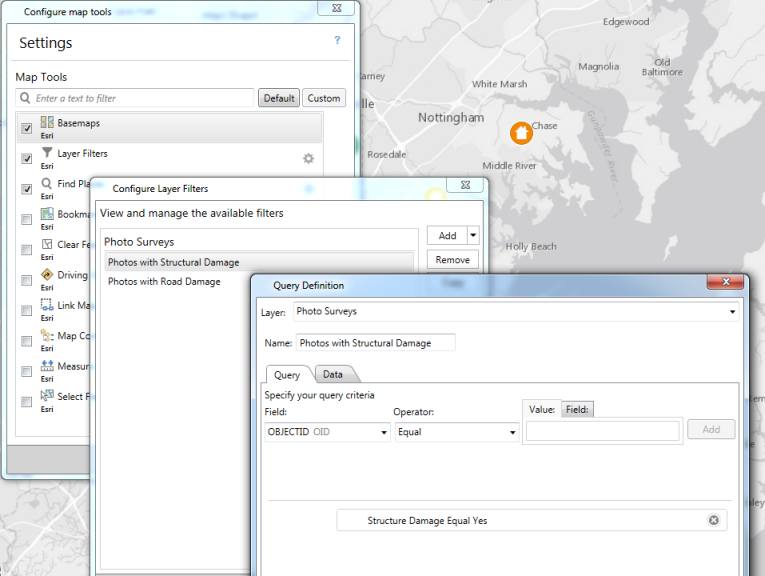
- Click to Configure map tools, then enable Basemaps, Layer Filters, and Find Places.
- Click to configure Layer Filters. Add filters to allow the user to filter surveys to display those with either Structural or Road damage, then click OK.
- Click OK to save the map tools configuration.
- Save the operation view and provide the following information:
- Title: Photo Survey Dashboard.
- Summary: An operations dashboard for organizations that can be used to monitor incoming photo surveys.
- Description: The Photo Survey Dashboard can be used by organizations to monitor incoming photo surveys.
- Thumbnail image: Your image.
- Share the operation view with your organization.