User Guide
The Impact Analysis app allows utilities to summarize facility asset information during storm or other incident. View the Impact Analysis application using the sample data and user guide below.
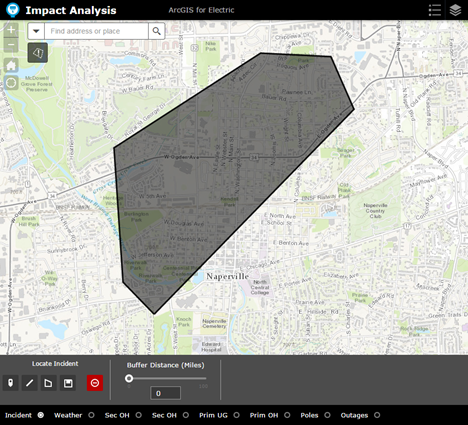
Define Incident
The Impact Analysis application can be used to summarize assets affected by an incident. To get started with this application, complete the following steps:
- Log in to your ArcGIS organization.
- Browse to the Impact Analysis application and open it in a browser.
- Open the Impact Analysis widget, located on the left side under the search box.
- Click the polygon icon on the widget panel.
- Draw a shape on the map.
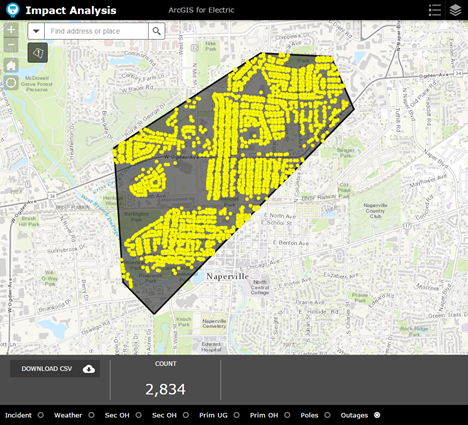
View Asset Summaries
After an area has been drawn, the summarization of assets in the area can be viewed. To learn more about the summarizations, complete the following steps:
- In the lower panel of the Situation Analysis widget, click through the radio buttons to view the summarization by type of asset.
- For the summarization of primaries and secondaries, you will be presented a count as well as miles impacted.
- For the summarization of poles and outage, you will be presented the count of features impacted.
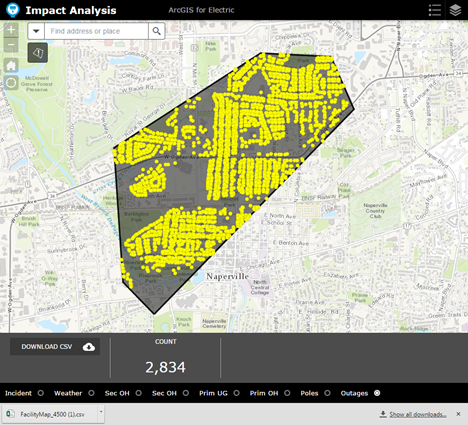
Export a CSV of Results
For each of the summarized assets, a CSV can be downloaded to use in other systems or for archiving. To save an asset summarization to a CSV, complete the following steps:
- Select a summarized asset. Ensure you see a count and (if applicable) miles of asset.
- Download the CSV
- Once downloaded, the CSV can be shared with others in your organization.
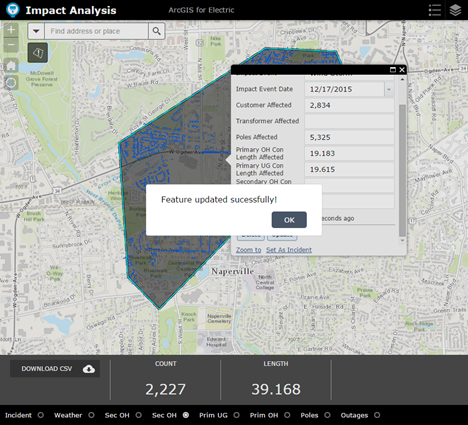
Save the Impact Area
Once an incident has been sketch in or selected, the results can be saved to a feature service to share or archive. To save an incident, complete the following steps:
- Click to the Incident button.
- Save the incident. When the feature is saved you will be presented a message verifying this.
- Edit the incident and update.