The Water Quality Dashboard can serve as a single destination for a collection of information such as such as the water quality status of each monitored waterbody, the status of water sampling efforts, a breakdown of waterbody types, and a dynamic view of water quality advisories.
Use the steps below to configure Water Quality Dashboard for your organization.
Water Quality Dashboard application
To create a Water Quality Dashboard application, complete the following steps:
- Open the ArcGIS Dashboards application.
- Create a new single display operation view.
Map and Data Sources
- In the Choose Map dialog, select the Water Quality Status map.
- Select the WaterQuality layer as a data source. Check on the option to make the WaterQuality layer selectable.
-
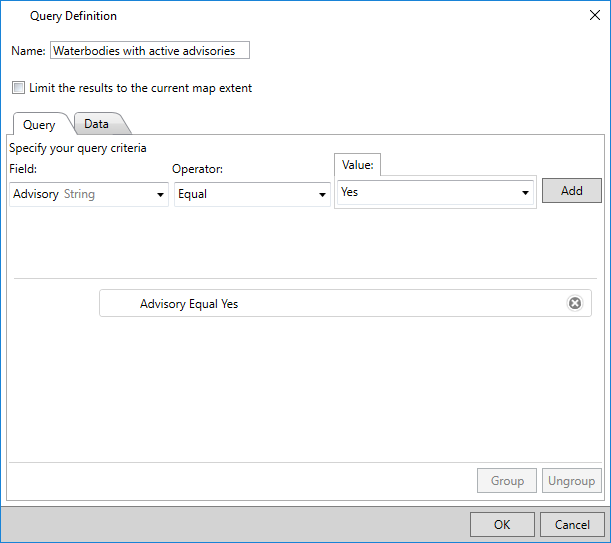
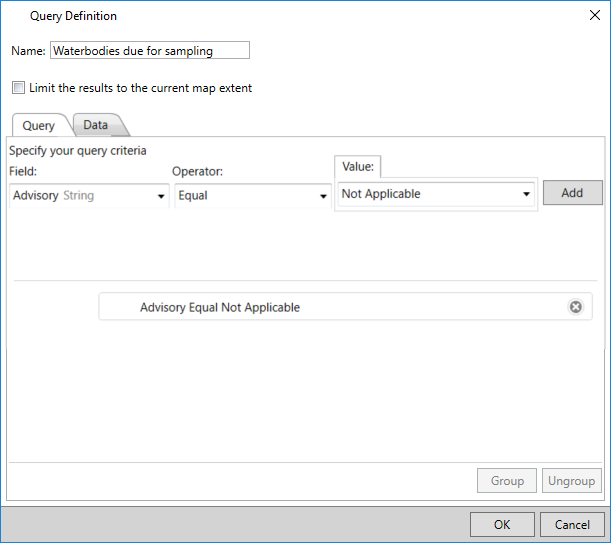
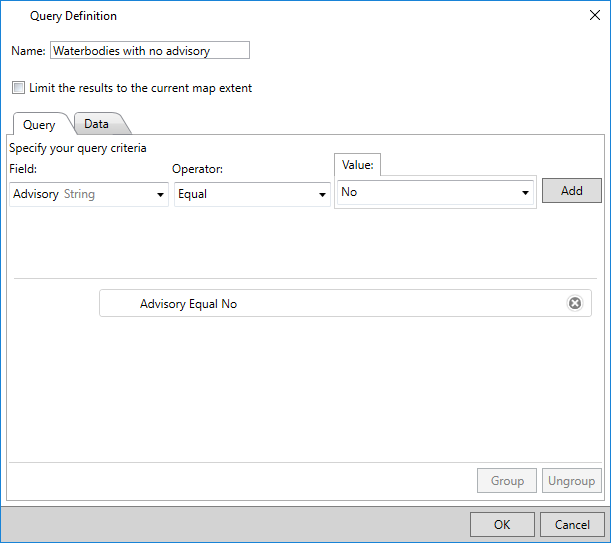
Click the Add button and define the following queries. These queries will be used by other widgets in the Water Quality Dashboard.
-
Waterbodies with active advisories.
-
Waterbodies that are due for sampling.
-
Waterbodies that have no active advisories.
-
Waterbodies with active advisories.
- If you have a related table containing historic water quality records for the monitored waterbodies, add the table containing historic water quality records as an external data source.
- Click the Widgets menu and choose External Data Sources.
- Click Add > Add Service URL and enter the URL to the historic water quality records table.
- Click OK, and click Close on the Data Sources window.
Monitored Waterbodies
Provide the total number of waterbodies being monitored, and list them by name.
- Click the Panel Setting drop-down and choose Insert Panel > Two Thirds Bottom.
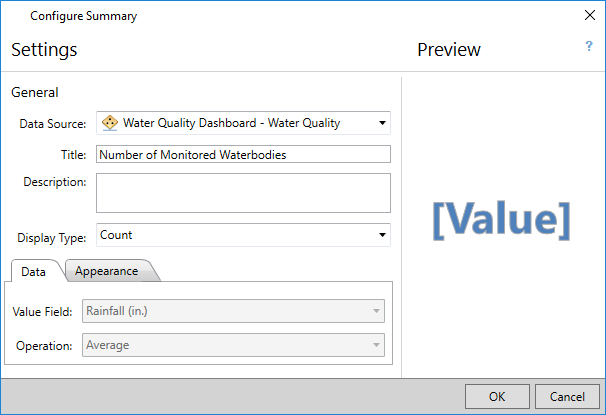
- Add a summary widget using the WaterQuality layer as the data source. This widget will display the number of waterbodies that are being monitored.
-
Name the widget Number of Monitored Waterbodies and change the Display Type to "Count".
- For the remaining widget on the panel, add a list widget and select the WaterQuality layer as the data source.
- Remove text from the Title setting, and check on the Allow Filter option.
- Set the Sort Field to Waterbody Name.
- On the Feature Display tab, set the Title to use the WATERBODYNAME field.
- On the Feature Actions tab, check on the Highlight and Zoom to options. Set the Double click option to Show pop-up.
Waterbody Types
Use a pie chart widget to display a breakdown of waterbodies by type.
- Click the Widgets menu and choose Add Panel > Full Page.
- Add a pie chart widget and select the WaterQuality layer as the data source.
- Name the widget Waterbodies by Type and configure the title and description.
- Set the Display Type to "Display feature counts as segments". Set the Value Field to use Waterbody Type. This widget will now show a pie chart illustrating the breakdown of waterbodies by type.
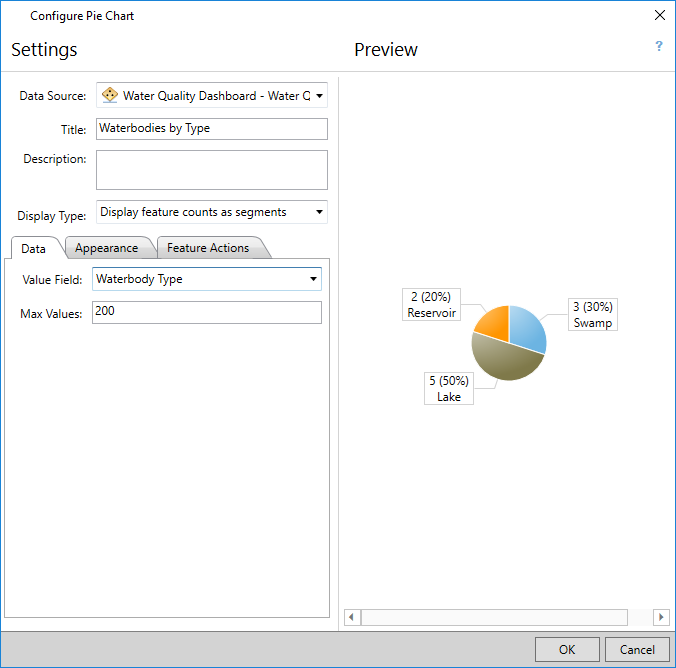
- On the Appearance tab, check on the Show Labels option.
Number of Waterbodies with Advisories
Communicate the number of waterbodies with active advisories, list them, and provide a description of the advisory.
- Click the Panel Setting drop-down and choose Insert Panel > Two Thirds Bottom.
- Add a summary widget using the Waterbodies with active advisories filter as the data source. This widget will display the number of waterbodies with active advisories.
-
Name the widget Number of Water Quality Advisories and change the Display Type to "Count".
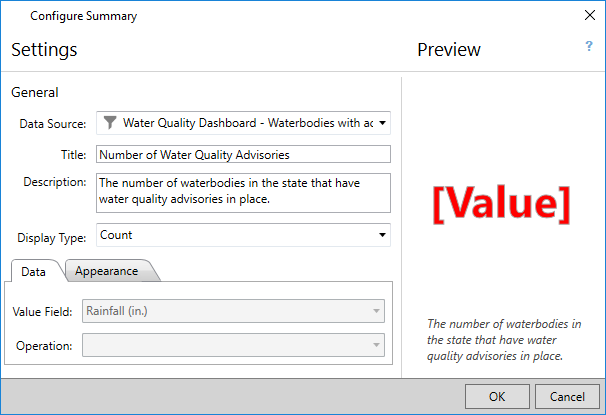
- For the remaining widget on the panel, add a list widget and select the Waterbodies with active advisories filter as the data source.
- Remove text from the Title setting, and check on the Allow Filter option.
- Set the Sort Field to Waterbody Name.
- On the Feature Display tab, remove text from the Title setting and select the Custom option. Configure the custom feature display settings to display the WATERBODYNAME field, as well as the field providing a description of the advisory.
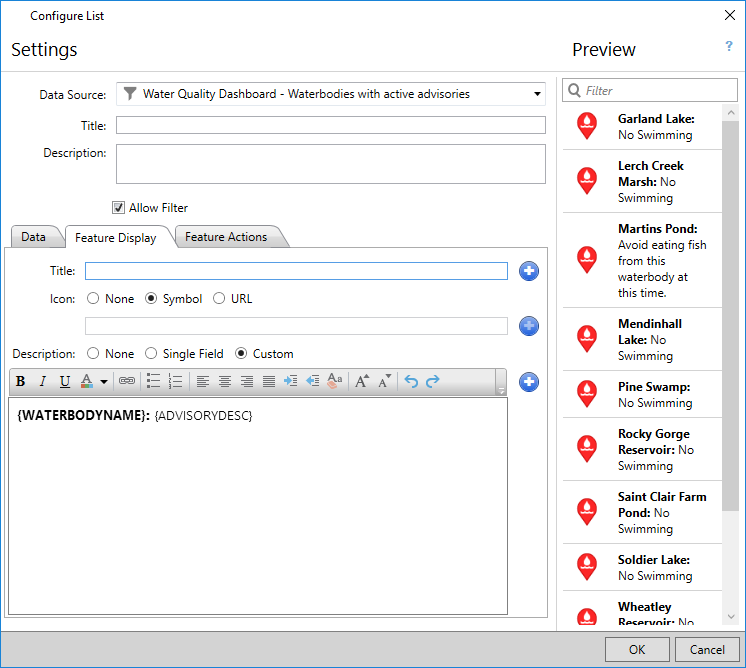
- On the Feature Actions tab, check on the Highlight and Zoom to options. Set the Double click option to Show pop-up.
Number of Waterbodies Due for Sampling
Communicate the number of waterbodies that are due to be sampled, and list them.
- Click the Panel Setting drop-down and choose Insert Panel > Two Thirds Bottom.
- Add a summary widget using the Waterbodies due for sampling filter as the data source. This widget will display the number of waterbodies that are due to be sampled.
- Name the widget Number of Waterbodies Due for Sampling and change the Display Type to "Count".
- For the remaining widget on the panel, add a list widget and select the Waterbodies due for sampling filter as the data source.
- Remove text from the Title setting, and check on the Allow Filter option.
- Set the Sort Field to Waterbody Name.
- On the Feature Display tab, set the Title to use the WATERBODYNAME field.
- On the Feature Actions tab, check on the Highlight and Zoom to options. Set the Double click option to Show pop-up.
Number of Waterbodies With No Advisory
Communicate the number of waterbodies that have no active advisory, and list them.
- Click the Panel Setting drop-down and choose Insert Panel > Two Thirds Bottom.
- Add a summary widget using the Waterbodies with no advisory filter as the data source. This widget will display the number of waterbodies that have no active advisory.
- Name the widget Number of Waterbodies with No Advisory and change the Display Type to "Count".
- For the remaining widget on the panel, add a list widget and select the Waterbodies with no advisory filter as the data source.
- Remove text from the Title setting, and check on the Allow Filter option.
- Set the Sort Field to Waterbody Name.
- On the Feature Display tab, set the Title to use the WATERBODYNAME field.
- On the Feature Actions tab, check on the Highlight and Zoom to options. Set the Double click option to Show pop-up.
Water Quality Advisories Breakdown
Use a pie chart widget to display a breakdown of water quality advisories.
- Click the Widgets menu and choose Add Panel > Full Page.
- Add a pie chart widget and select the WaterQuality layer as the data source.
- Name the widget Water Quality Advisories Breakdown and configure the title and description.
- Set the Display Type to "Display feature counts as segments". Set the Value Field to use Advisory. This widget will now show a pie chart illustrating the breakdown of water quality advisories by type.
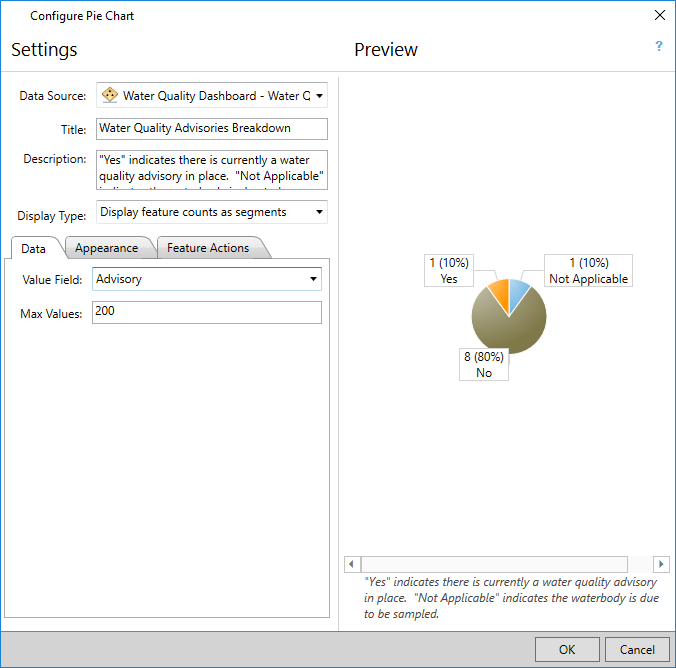
- On the Appearance tab, check on the Show Labels option.
Historic Water Quality Records
If you have a related table containing historic water quality records for monitored waterbodies, configure the Water Quality Dashboard to allow users to discover these historic water quality records.
- Allow users to select features by clicking "Add, remove, and configure map tools" and checking on the Select Features tool. Click OK.
- Click the Widgets menu and choose Add Panel > Thirds.
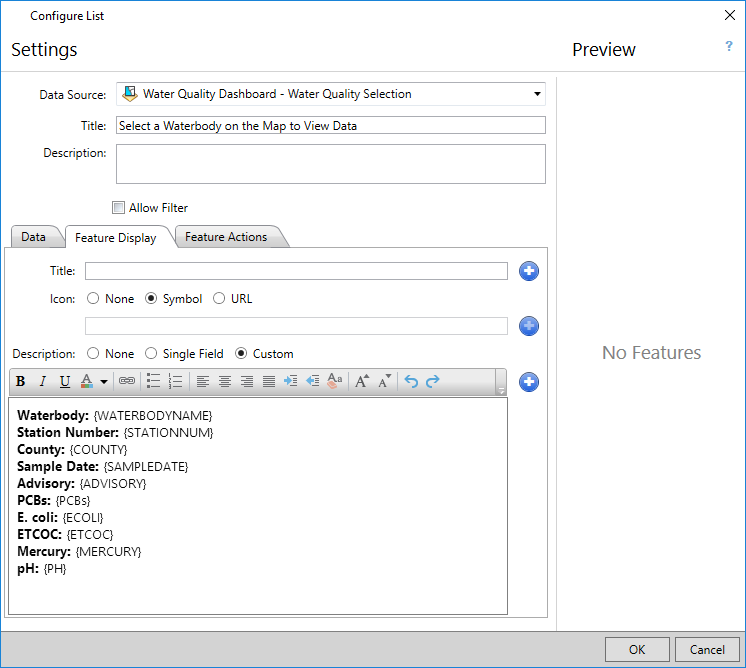
- For the top widget, add a list widget and select the Water Quality Selection layer as the data source.
- Name the widget Select a Waterbody on the Map to View Data, and set the Sort Field to use Waterbody Name.
- On the Feature Display tab, use the Custom display option and configure the display of water quality data for the selected feature(s).
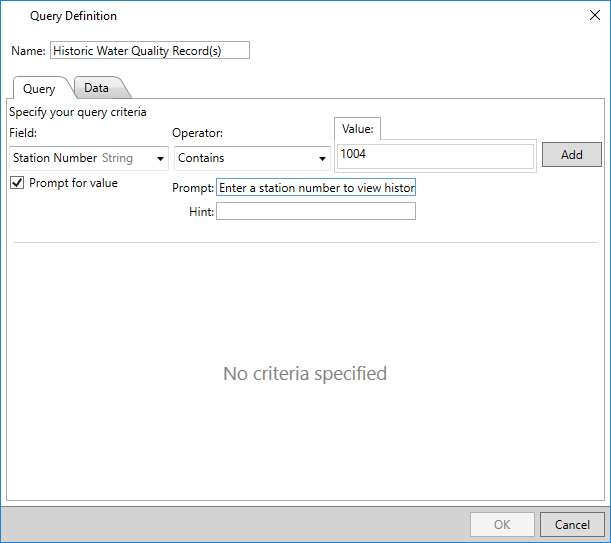
- For the middle widget, add a query widget and select the table containing historic records as the data source.
- Name the widget Find Historic Water Quality Record(s).
- Click Add, and configure a query definition that prompts the user to enter a Station Number to search for historic record(s).
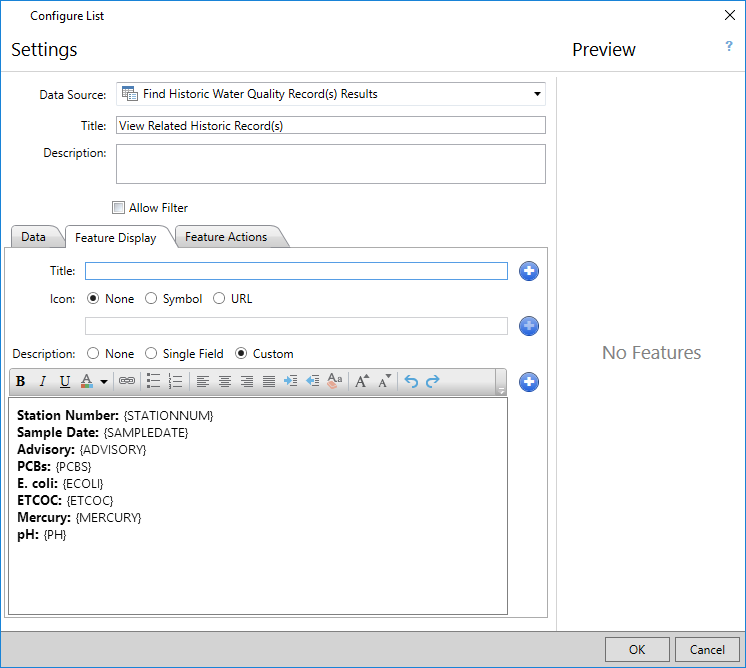
- For the bottom widget, add a list widget and select the Find Historic Water Quality Record(s) Results from the query widget above as the data source.
- On the Feature Display tab, use the Custom display option and configure the display of historic water quality data.
Save and Share the Dashboard
-
Save the operation view and in the Single display device section add the following information:
- Name: Water Quality Dashboard
- Summary: A dashboard for tracking water quality monitoring efforts.
- Description: A dashboard for Environment and Natural Resources, Fish and Wildlife, and Health organizations that can be used to track water quality monitoring efforts in the state.
- Thumbnail Image: your image
- Share the operation view with your Water Quality Monitoring group.
- Create ArcGIS Online accounts for staff in your department and invite them to join the Water Quality Monitoring group.
- Sign in to the ArcGIS Dashboards application to access the Water Quality Dashboard.