Overview
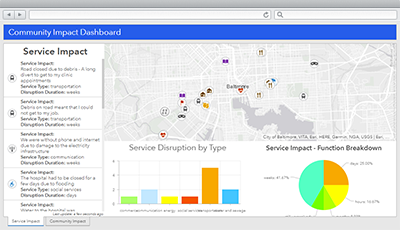
Community Impact Dashboard can be used to monitor impact reports and understand how community resiliency can be improved.
The Community Impact Dashboard can be used to present aggregated information about community impact reports collected by Community Impact. By aggregating community impact reports, organizations can better understand how resilience can be improved, and which areas are more affected.
Requirements
To deploy Community Impact Dashboard with the ArcGIS Solutions Deployment Tool requires specific software.
| Requirement | Description |
| Software |
Solution deployment
Solution hosting
|
| Application |
|
What you get
Community Impact Dashboard can be deployed in your ArcGIS organization without downloading the solution. When you deploy Community Impact Dashboard in your organization, you'll find the following:
| Item | Name | Description |
| Application | Community Impact Dashboard | An application used by emergency management personnel to monitor impact reports and understand how community resiliency can be improved. |
| Map | Community Impact | A map used to share information about community impact reports. |
| Feature Layer | CommunityImpact | A feature layer used to store social impact and service impact reports. |
What's new
Below are the release dates and notes for Community Impact Dashboard.
| Date | Description |
| November 2021 |
|
| April 2018 |
|
| September 2017 |
|