Overview
After a major storm event, one important task is determining the extent of damages to the network. The Damage Assessment Collector solution enables field crews to record damages in the field and immediately share the information with the office. However, this information needs to be communicated with operation managers to decide the best use of resources to repair distribution network damages.
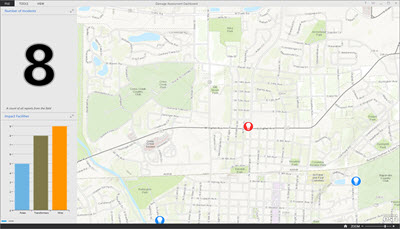
The Damage Collection Dashboard allows operation managers to view and better understand the extent of damages collected in the field. This solutions uses your ArcGIS organization and the ArcGIS Dashboards to extract additional information from the damages collected in the field, and provides a basic, hands off view of the information as data is collected in the field. This can then be used to aid managers to determine the extent of damages and the best locations to deploy crews and equipment.
Requirements
Damage Collection Dashboard requires specific technical experience and software.
| Requirement | Description |
| Software |
Solution deployment
Solution hosting
|
| Applications |
|
What you get
When you deploy Damage Assessment Dashboard, you'll find the following:
| Item | Name | Description |
| Operation View | Damage Assessment Dashboard | An operation view used to view information about damages collected in the field. |
| Map | Damage Assessment Viewer | A map used in the Damage Assessment Dashboard to view damages collected in the field. |
What's new
Below are the release dates and notes for Damage Collection Dashboard.
| Date | Description |
| November 2020 |
|
| September 2018 |
|
| June 2017 |
|
January 2017 |
|
| February 2016 |
|
| August 2015 |
|
| July 2015 |
|
| September 2013 |
|