Overview

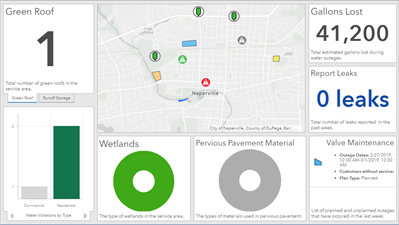
When collecting stormwater best management practices and watering violations using Collector for ArcGIS, operations managers need to view the progress and results of these field operations and additional service shutdown information. One option for viewing water conservation efforts is the Water Conservation Dashboard. This provides a map view of water conservation field operations and data extracting info graphics, or widgets, using ArcGIS Dashboards. This dashboard can then be used by managers to understand and ensure the completion of water conservation field operations.
Requirements
Water Conservation Dashboard requires specific technical experience and software.
| Requirement | Description |
| Software | Solution deployment
Solution hosting
|
| Applications |
|
| Prerequisites |
|
What you get
When you deploy Water Conservation Dashboard, you'll find the following:
| Item | Name | Description |
| App | Water Conservation Dashboard | An operation view used to provide a holistic view of water conservation efforts at a water utility. |
| Map | Water Conservation | A map used in the Water Conservation Dashboard to view water conservation efforts. |
What's new
Below are the release dates and notes for Water Conservation Dashboard.
| Date | Description |
| June 2020 |
|
| March 2019 |
|
| September 2018 |
|
| June 2017 |
|
| August 2015 |
|
| November 2013 |
|
Get started with Water Conservation Dashboard
Top
You may be interested in