The Value Analysis map and the ArcGIS Dashboards can be used to visualize the impact of sales, foreclosures, and assessment appeals on property value in a neighborhood or tax district.
Value Analysis Dashboard
To create a value analysis dashboard, complete the following steps:
- Open the ArcGIS Dashboards application.
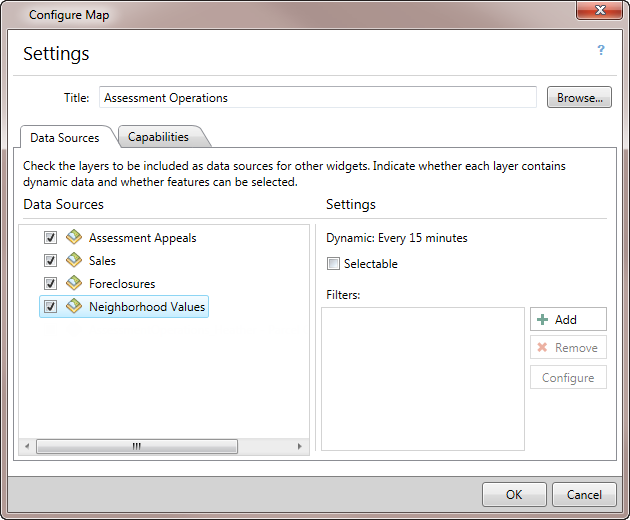
- Create a new single-display operation view and choose the Value Analysis map.
- Select all of the layers as the data source, and then click OK.
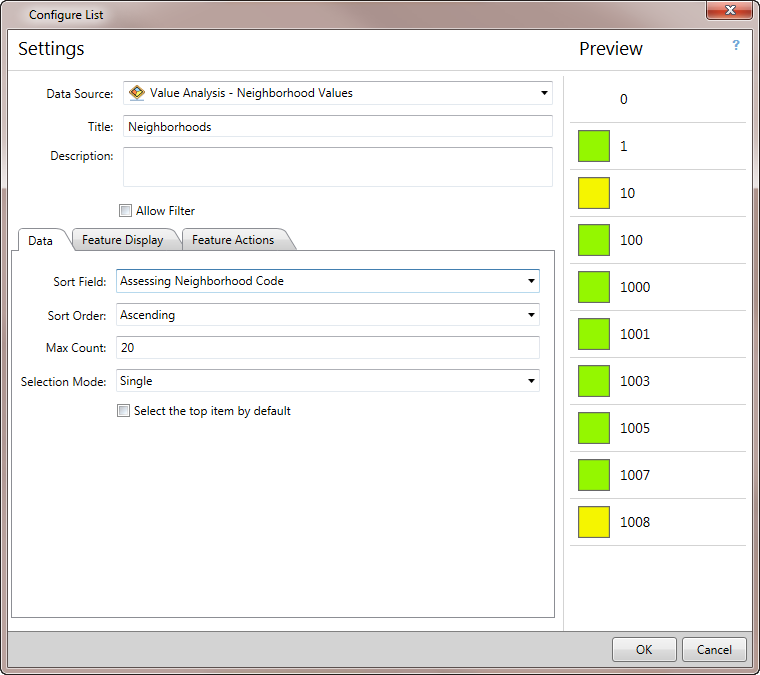
- Add a list widget and choose Value Analysis - Neighborhood Values as the data source. Name the widget Neighborhoods.
- In the Data tab, set the Sort Field to Assessing Neighborhood Code.
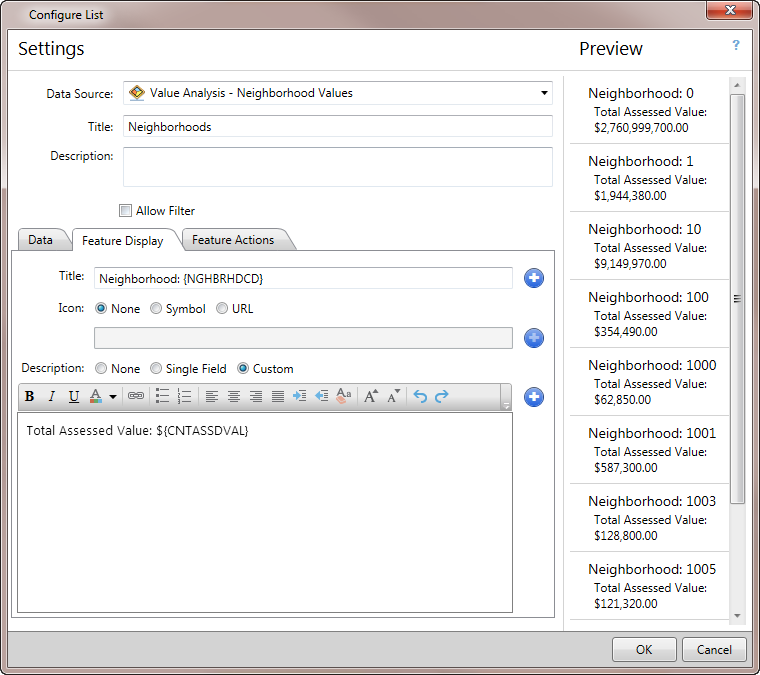
- Click the Feature Display tab and type Neighborhood: into the Title text box.
- Set the Icon type to None.
- Build a custom description by clicking Custom and typing Total Assessed Value:$ into the text box. Click the Insert Field button and choose Current Assessed Value {CNTASSDVAL}.
- Click the Feature Actions tab and enable Show pop-up and Highlight tools, then choose Show pop-up in the Double click drop-down.
- Click OK.
- Add a indicator widget and choose Neighborhoods - Neighborhood Values Section as the data source. Name the widget Change in Assessed Value.
- In the Data tab, set Value Field to Assessed Value Year Over Year Change.

- Click the Target Range tab and set the Comparison to Greater than.
- Click the Appearance tab and type $ into the Leading Text box.
- Set the Name Field to Assessing Neighborhood Code, and then click OK.
- Click Panel Settings > Layout > Thirds.
- Add a another indicator widget and choose Neighborhoods - Neighborhood Values Section as the Data Source. Name the widget Change in Tax Revenue.
- In the Data tab, set the Value Field to Taxable Value Year Over Year Change.
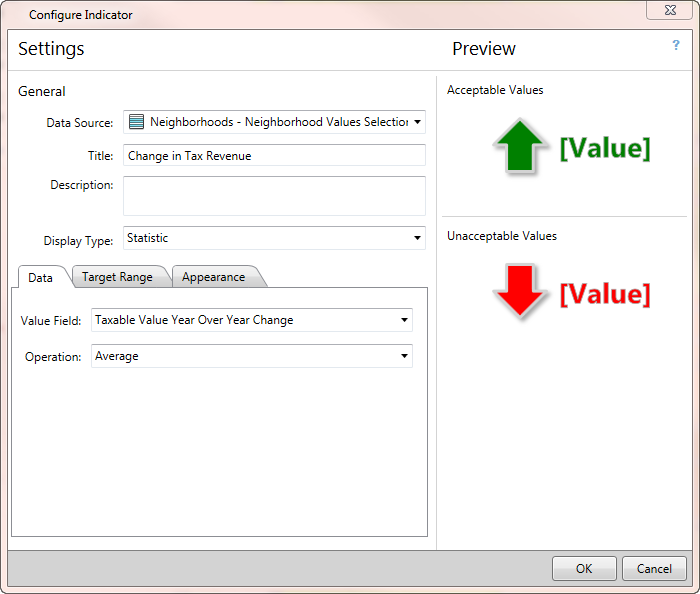
- Click the Target Range tab and set the Comparison to Greater than.
- Click the Appearance tab and type $ into the Leading Text box.
- Set the Name Field to Assessing Neighborhood Code, and then click OK.
- Add a a new panel by clicking Panel Settings > Insert Panel > Halves.
- Add a list widget and choose Value Analysis - Assessment Appeals as the data source. Name the widget Appeals.
- In the Data tab, set the Sort Field to Full Site Address.
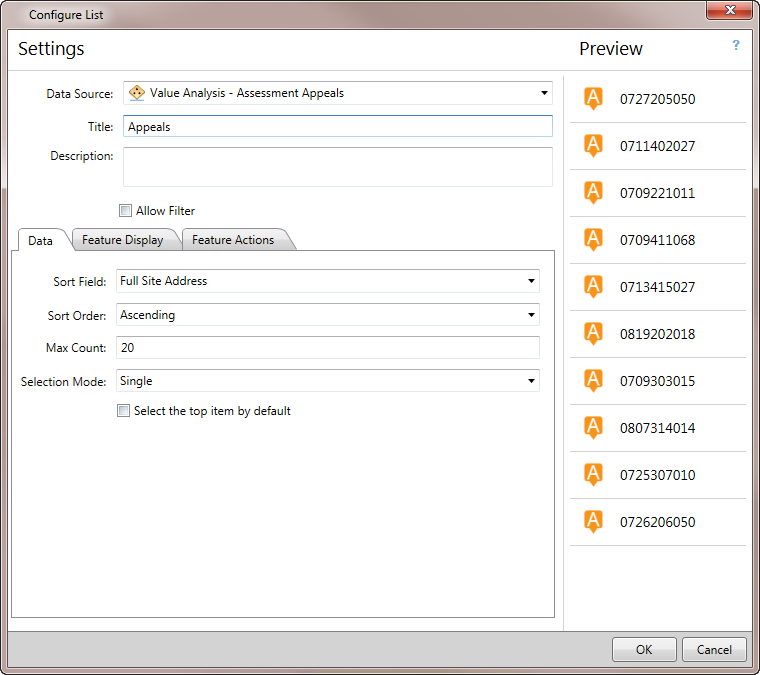
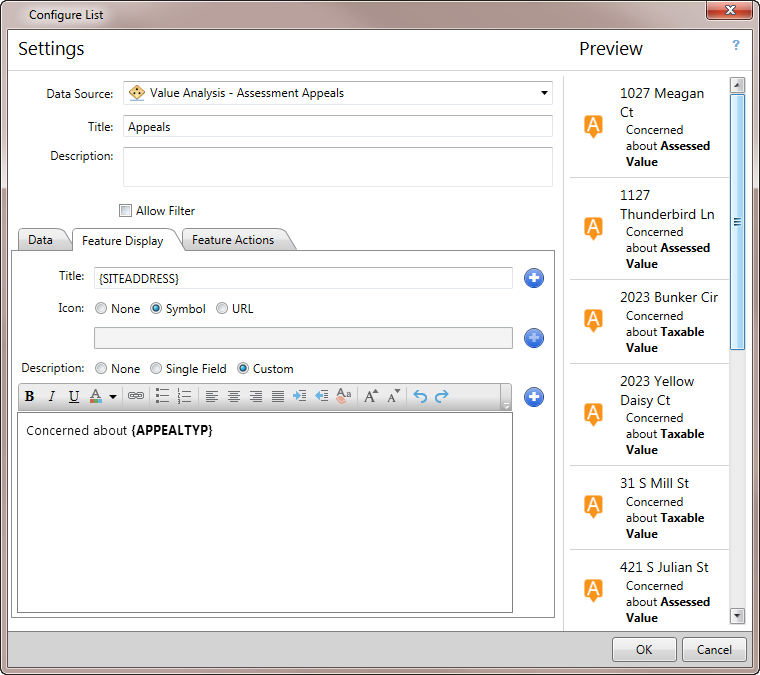
- Click the Feature Display tab, and in the Title text box, delete {PARCELID} then click on the Insert Field button and choose Full Site Address {SITEADDRESS}.
- Build a custom description by clicking Custom and typing Concerned about into the text box. Click the Insert Field button and choose Appeal Type {APPEALTYP}, then change the text formatting to bold.
- Click the Feature Actions tab and enable Show pop-up tool, then choose Show pop-up in the Double click drop-down.
- Click OK.
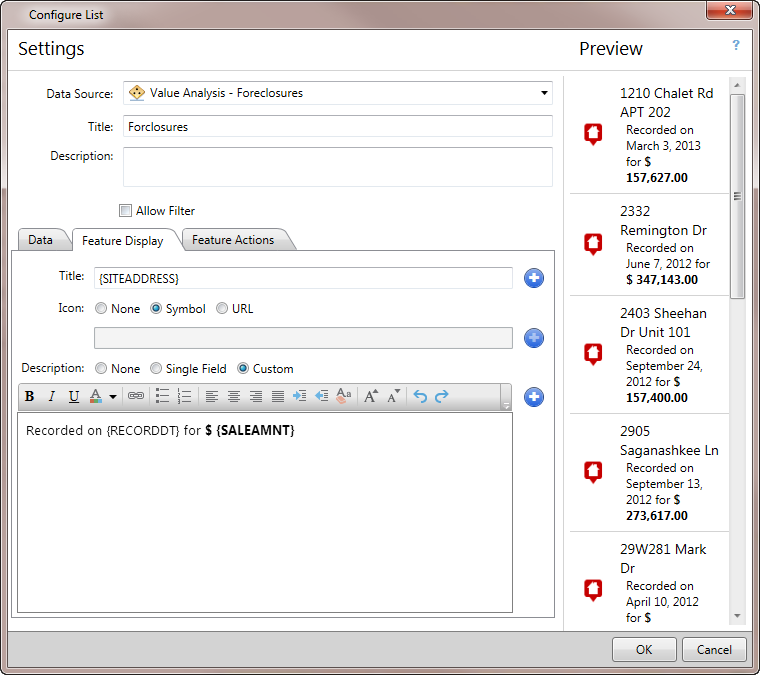
- Add a list widget using Value Analysis - Foreclosures as the data source. Name the widget Foreclosures.
- In the Data tab, set the Sort Field to Full Site Address.
- Click the Feature Display tab, and in the Title text box, delete {DOCNAME} then click on the Insert Field button and choose Full Site Address {SITEADDRESS}.
- Build a custom description by clicking Custom and typing Recorded on into the text box. Click the Insert Field button and choose Date Recorded {RECORDDT}.
- Type for $ into the text box.
- Click the Insert Field and choose Sale Amount {SALEAMNT}, then change the ${SALEAMNT} text formatting to bold.
- Click the Feature Actions tab and enable Show pop-up tool, then choose Show pop-up in the Double click drop-down.
- Click OK.
- Add a a new panel by clicking Panel Settings > Insert Panel > Halves.
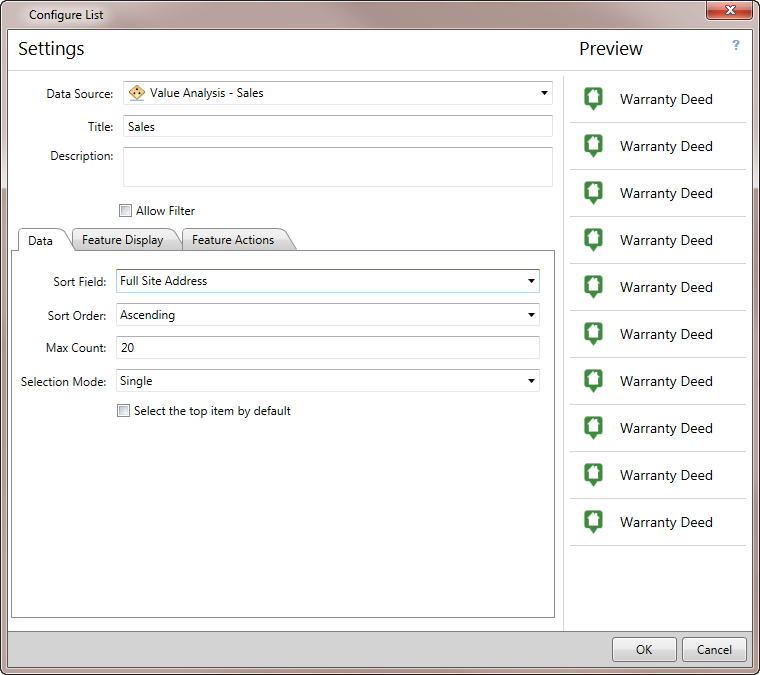
- Add a list widget using Value Analysis - Sales as the data source. Name the widget Sales.
- In the Data tab, set the Sort Field to Full Site Address.
- Click the Feature Display tab, and in the Title text box, delete {DOCNAME}, then click on the Insert Field button and choose Full Site Address {SITEADDRESS}.
- Build a custom description by clicking Custom and typing Sold for $ into the text box. Click the Insert Field button and choose Sales Amount {SALEAMNT}, then change the ${SALEAMNT} text formatting to bold.
- Type on into the text box, then click the Insert Field again and choose Transaction Date {TRANSDT}.
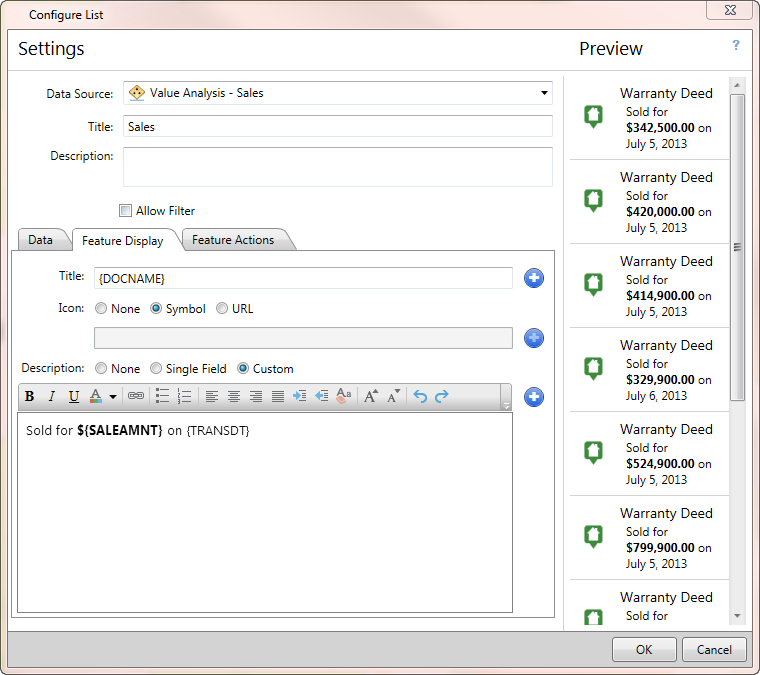
- Click the Feature Actions tab and enable Show pop-up tool, then choose Show pop-up in the Double click drop-down.
- Click OK.
- Add a gauge widget using Sales - Sales Selection as the data source. Name the widget Sales Ratio (50% Target).
- In the Data tab, set the Value Field to Sales Ratio and Operations to Maximum.
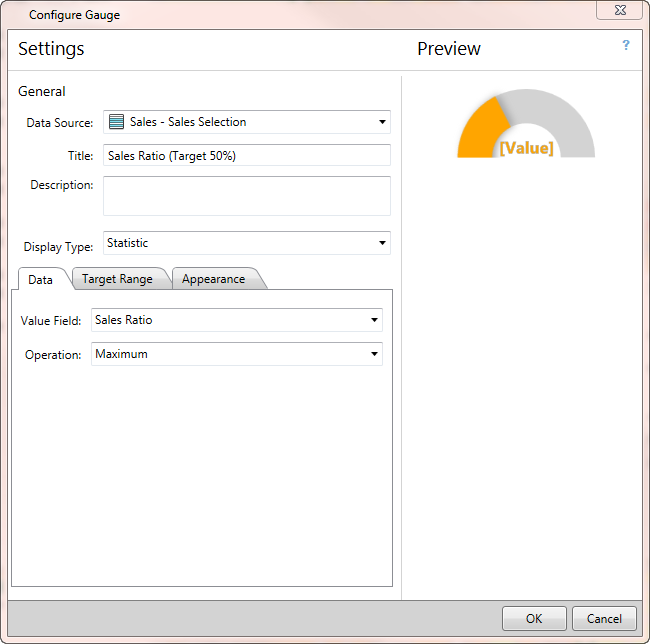
- Click the Target Range tab and enable Threshold Value and Percentage, then set the Value to 50.
- Click the Appearance tab and set the Value Label to Percentage.
- Change the Below or equal to Threshold Color and Above Threshold Color to red.
- Set the Name Field to Full Site Address, and then click OK.
- Save the operation view as Value Analysis Dashboard and provide a summary and a description.
Once you've configured the Dashboard to monitor property value, share your Value Analysis Dashboard with Assessor's office staff so they can visualize changes in property assessments and tax revenue in your community and understand where sales, foreclosures, and assessment appeals may be occurring.