The ArcGIS Dashboards application can be used to visualize and summarize photo surveys as they are submitted. Photo surveys can then be monitored to view overall progress and determine if the property condition reported through the survey needs further attention.
The ArcGIS Dashboards application consumes maps that are accessible to named users in your ArcGIS Online organization. Create a Photo Survey map and share it with operations staff responsible for monitoring photo surveys. Operations staff can then access the configurations of the ArcGIS Dashboards applications on their desktop computers and tablet devices.
The steps below show you how to create a Photo Survey map and a dashboard for monitoring blight surveys, however you can use your own data when for creating your map and Dashboard.
Photo Survey map
To create an ArcGIS Online Photo Survey map, complete the following steps:
- Sign in to your ArcGIS Online organization.
-
Create a map used to monitor photo survey, by completing the following workflows:
- Choose a basemap.
- Add the PhotoSurvey layer to the map.
- Configure pop-ups for the PhotoSurvey layer.
- Save the map as Photo Survey Dashboard.
- Make two copies of the PhotoSurvey layer for each property condition that you want to view.
-
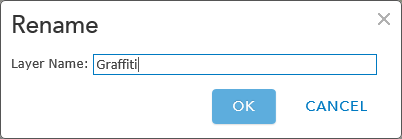
Rename the first layer Graffiti, second layer Yard Overgrowth, and the third layer Roof Damage, then change the style for each layer.
-
Apply a filter to the Graffiti layer, by using the following filter expression:
Graffiti Damage is Yes.
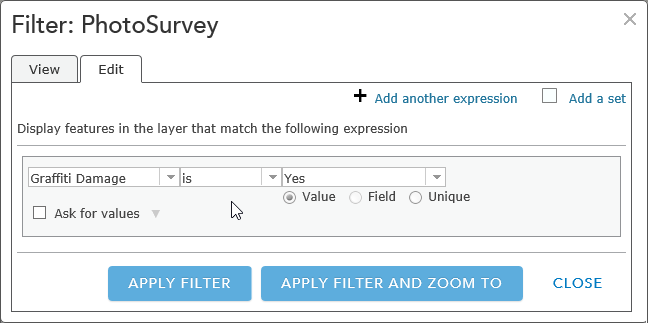
An example of a filter configuration - Apply a filter to the Yard Overgrowth layer, by using the following filter expression: Overgrowth Lot is Yes.
- Apply a filter to the Roof Damage layer, by using the following filter expression: Roof Damage is Yes.
- Save the map and share it with your organization.
Photo Survey Dashboard
To create a Photo Survey Dashboard, complete the following steps:
- Open the ArcGIS Dashboards application.
- Create a new single-display operation view and choose the Photo Survey Dashboard map.
-
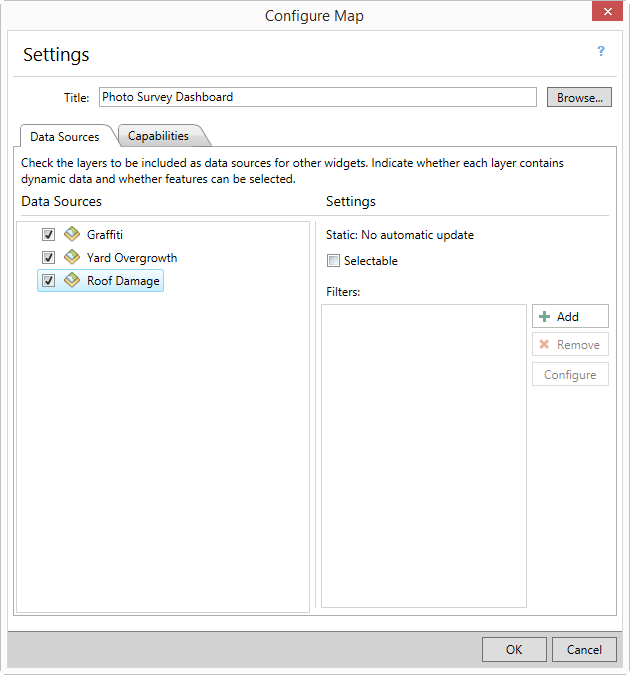
Select all of the layers as a data source, and then click OK.
- Click Panel Settings > Layout > Halves.
- Add a list widget and choose the Photo Survey Dashboard - Graffiti as the data source. Name the widget Reported Graffiti and check the Allow Filter check box.
-
In the Data tab, set the Sort Field to PIN.
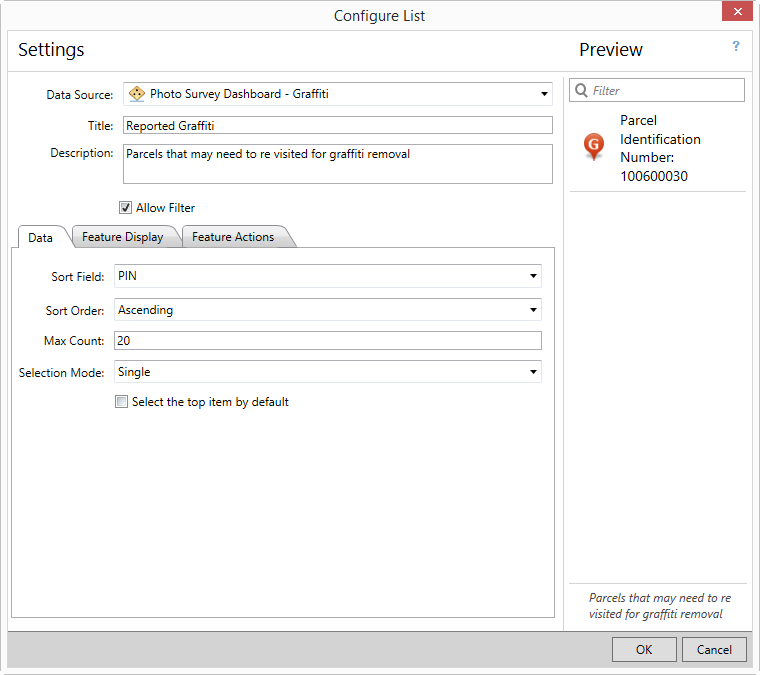
- Click the Feature Display tab, and type Parcel: in to the Title text box, then click on the Insert Field button and choose PIN {PIN}.
- Click the Feature Actions tab and enable Show pop-up, Highlight, Zoom to tools, then choose Highlight in the Double click drop-down.
- Click OK.
-
Add a summary widget and choose the Photo Survey Dashboard - Graffiti as the data source. Name the widget Properties with Reported Graffiti. Click the Display Type drop-down and choose Count.
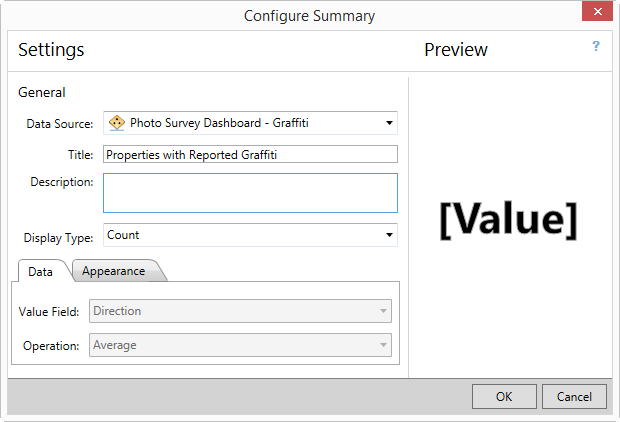
- Click OK.
- Add a new panel by clicking Panel Settings > Insert Panel > Halves.
- Add a list widget and choose the Photo Survey Dashboard - Yard Overgrowth as the data source. Name the widget Tall Grass or Overgrown Lawns Reported and check the Allow Filter check box.
- Repeat steps 5 through 9 above to create a Tall Grass or Overgrown Lawns Reported list widget.
- Add a summary widget and choose the Photo Survey Dashboard- - Yard Overgrowth as the data source. Name the widget Properties with Tall Grass or Overgrown Lawns. Click the Display Type and choose to Count.
- Click OK.
- Add a new panel by clicking Panel Settings > Insert Panel > Halves.
- Add a list widget and choose the Photo Survey Dashboard- - Roof Damage as the data source. Name the widget Roof Damage Reported and check the Allow Filter check box.
- Repeat steps 5 through 9 above to create a Tall Grass or Overgrown Lawns Reported list widget.
-
Save the operation view and provide the following information:
- Title: Photo Survey Dashboard.
- Summary: An operations dashboard for organizations that can be used to monitor incoming photo surveys.
- Description: The Photo Survey Dashboard can be used by organizations to monitor incoming photo surveys.
- Thumbnail image: Your image.
- Share the operation view with your organization.