The ArcGIS Dashboards application can be configured and used by executives to monitor the status of capital projects. Local government leaders can then access the dashboard on their desktop computers and tablet devices.
To create a Capital Projects dashboard, complete the following steps:
- Open the ArcGIS Dashboards application.
- Create a new single display operation view and choose Capital Projects - Executive Dashboard map, then click Open.
-
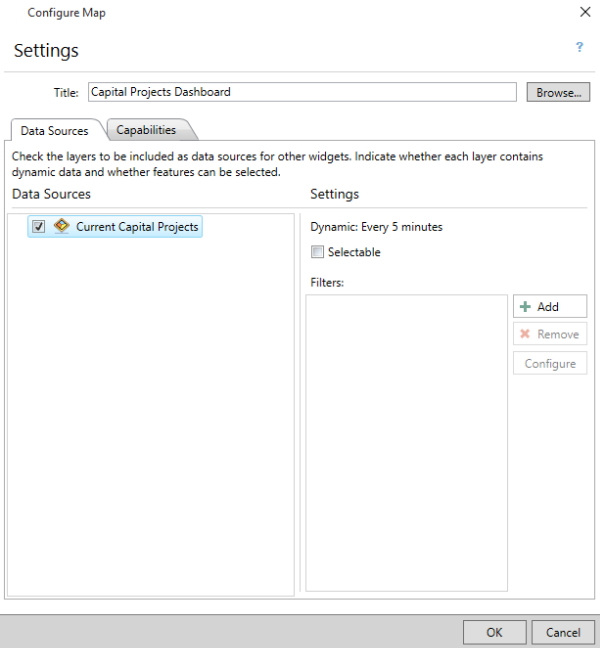
Choose Current Capital Projects as the data source, and click OK.
- Clicking Panel Settings > Layout > Two Thirds Bottom.
- Add a list widget and choose Capital Projects Executive Dashboard - Current Capital Projects as the data source. Name the widget Current Project Portfolio and check the Allow Filter check box.
-
In the Data tab set the Sort Field to Planned Start Date and Sort Order to Descending.
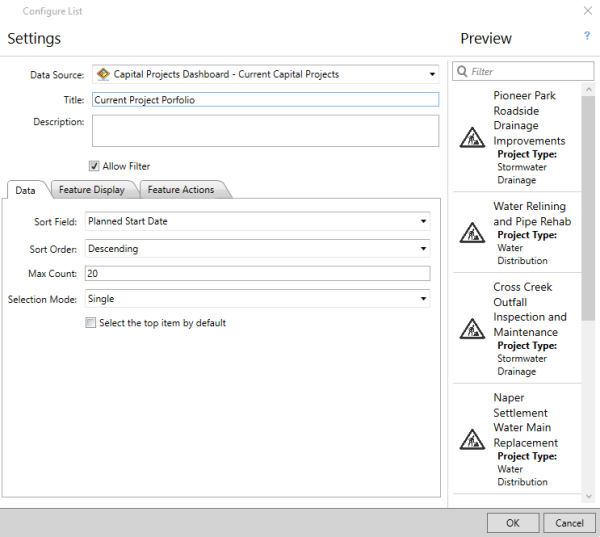
- Click the Feature Display tab, then in the Title text box click on the Insert Field button and choose Project Name {PROJNAME}.
- Optionally, set the Icon type to URL and provide a URL.
- Build a custom description by clicking Custom and typing Project Type: into the text box, before changing the text formatting to bold. Click the Insert Field button and choose Project Type {PROJTYPE}.
- Click the Feature Actions tab and enable Zoom to and Show pop-up tools, then choose Highlight and in the Double-Click drop-down.
- Click OK and dock the widget on the left side of the operation view.
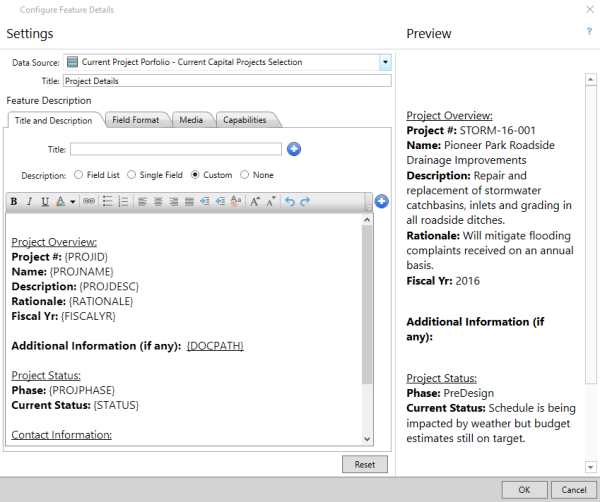
- Click Widget > Add Widget and choose the feature details widget, then click OK. Choose the Current Project Portfolio - Current Capital Projects Selection as the data source, and name it Project Details.
- In the Title and Description tab, remove Capital Projects: from the Title text box.
- Build a custom description by clicking Custom and typing the following into the text box on separate lines:
- Project Overview:
- Project #:
- Name:
- Description:
- Rationale:
- Fiscal Yr:
- Additional Information (if any):
- Project Status:
- Phase:
- Current Status:
- Contact Information:
- Click the Insert Field button and add the following fields:
- {PROJID} next to Project #:
- {PROJNAME} next to Name:
- {PROJDESC} next to Description:
- {RATIONALE} next to Rationale:
- {FISCALYR} next to Fiscal Yr:
- DOCPATH next to Additional Information (if any):
- {PROJPHASE} next to Phase:
- {STATUS} next to Current Status:
- {POCNAME} under Contact Information:
- {POCPHONE} under {POCNAME}
- {POCEMAIL} under {POCPHONE}
- Project status was last updated by {Editor} on {EditDate} under {POCEMAIL}.
- Change the text formatting of the titles to bold and underline but do not change the formatting of the fields to bold.
- Add a new panel by clicking Widgets > Add Panel > Halves to display additional project information.
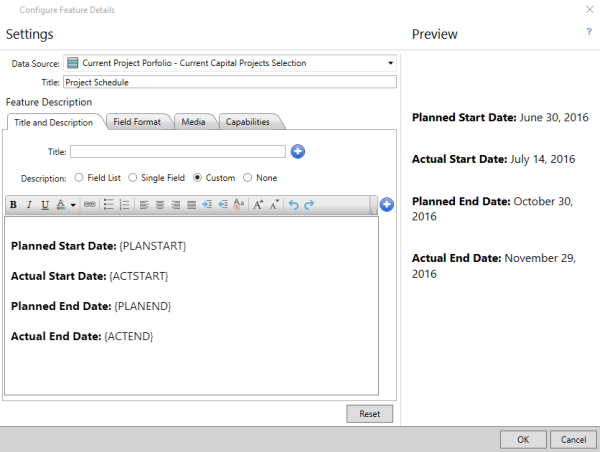
- Click Widget > Add Widget and choose the feature details widget, then click OK. Choose the Current Project Portfolio - Current Capital Projects Selection as the data source, and name it Project Schedule.
- In the Title and Description tab, remove Capital Projects: from the Title text box.
- Build a custom description by clicking Custom and typing the following into the text box on separate lines:
- Planned Start Date:
- Actual Start Date:
- Planned End Date:
- Actual End Date:
- Click the Insert Field button and add the following fields:
- {PLANSTART} next to Planned Start Date:
- {ACTSTART} next to Actual Start Date:
- {PLANEND} next to Planned End Date:
- {ACTEND} next to Actual End Date:
- Change the text formatting of the titles to bold but do not change the formatting of the fields to bold.
- Add a bar chart widget and choose the Current Project Portfolio - Current Capital Projects Selection as the data source. Name the widget Budget Analysis. Click the Display type and choose Display attribute values as bars.
- In the Data tab, check the Estimated Cost ($) and Actual Cost ($) check boxes.
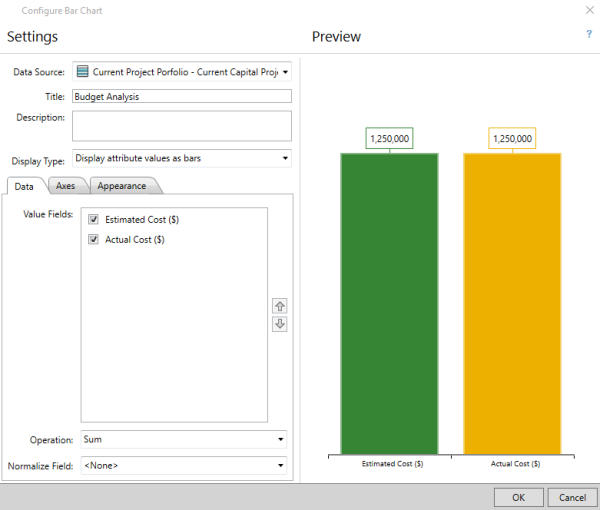
- Click the Appearance tab and set the Layout to Columns, then check the Show Labels and Use color ramp check boxes. Choose a color ramp for your bar chart, then click OK.
- Save the operation view and edit the item details.
- Share the Capital Projects - Executive Dashboard with your Engineering and Construction group.