Configure a Crime and Disorder map and share it with command staff, patrol officers, analysts, and investigators. Law enforcement professionals can then visualize it on their desktop computers and identify where crime and disorder is occurring in your community using a configuration of ArcGIS Web AppBuilder Near Me and Filter widgets.
Crime and Disorder map
To create an ArcGIS Online Crime and Disorder map, complete the following steps:
- Sign in to your ArcGIS Online organization.
- Create a Command Staff group for staff in your law enforcement organization.
- Create a map for the Crime and Disorder application, by completing the following workflow:
- Choose the Light Gray Canvas basemap.
- Add the PoliceBeats and Offenses layer to the map.
- Configure pop-up for the Offenses layer using a list of field attributes option.
- Save the map as Offense Map, then type in tags that describe your map and enter a summary.
- Disable Time Animation on the Offenses layer.
- Change the transparency on the PoliceBeats layer to 75%.
- Save the map and share it with your Command Staff group.
Crime and Disorder application
The Crime and Disorder application helps command staff, patrol officers, analysts, and investigators visualize crime and disorder in specific police beats. This application can be hosted in ArcGIS Online and accessed by Law enforcement professionals on a smartphone, tablet, and desktop computers.
To configure the Crime and Disorder application using ArcGIS Online, complete the following steps:
- Sign in to your ArcGIS organization.
- Create an app using Web AppBuilder and add the following:
- Title: Crime and Disorder.
- Tags: Law Enforcement.
- Summary: The crime and disorder application helps command staff, patrol officers, analysts, and investigators visualize crime and disorder in specific areas.
- Click the Theme tab and choose the Tab Theme, then choose a Style and Layout for your Crime and Disorder application.
- Click the Map tab and if necessary click Choose Web Map, then browse to the Crime and Disorder map, and click OK.
- Click the Widget tab, then click Set the widgets in this controller and remove the Legend widget and Layer List widget.
- Click + to open the widget collection and choose the Near Me widget, and then click OK.
- Change the name of the Near Me widget to Find Crimes Near Me.
- In the Search Settings section, do the following:
- Select search layer(s), by clicking the Set button and checking the check boxes next to Offenses layer, and then click OK.
- Check the box to enable the Only draw selected layer results property.
- Set the default buffer distance to 1,000, maximum buffer distance to 5,000, and choose Feet from the Buffer distance units drop-down list.
- Click OK.
- Click + to open the widget collection and choose the Filter widget, and then click OK.
- Change the name of the Filter widget to Select a Crime and Disorder Filter.
- Click + New Filter and choose the Offenses - District layer from the Layer drop-down list.
- Name the filter in the Title text box.
- Click Add a filter expression and build a filter expression using the UCR Description field to filter on a specific crime type. When applying multiple filters expressions, choose to get features in the layer that match Any of your expressions.
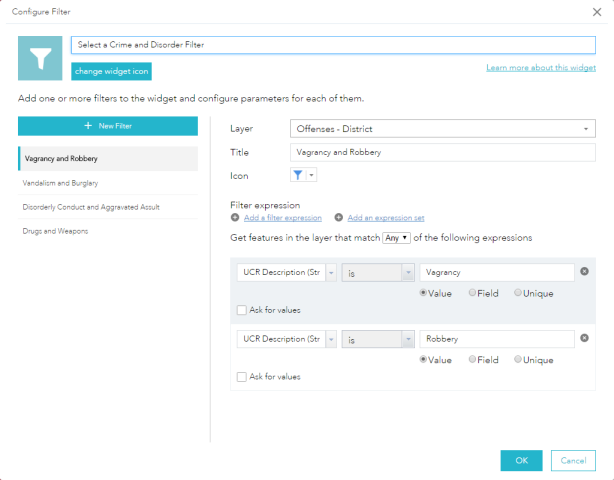
An example of a filter expression configuration - Click OK.
- Click the Attribute tab and remove the subtitle.
- Save the application.
- Browse to the Crime and Disorder application and edit the item details.
- Thumbnail Image: Your image.
- Description: The crime and disorder application helps command staff, patrol officers, analysts, and investigators visualize crime and disorder in specific areas.
- Share the application with your Command Staff group.
- Launch the Crime and Disorder application.