The information contained in the Repeat and Near Repeat Incident Summary report contains several pieces of critical information.
- Estimated half-distance and half-life values calculated for each space and time band evaluated by the tool. These values can be used to populate the associated parameters in the Calculate Prediction Zones tool.
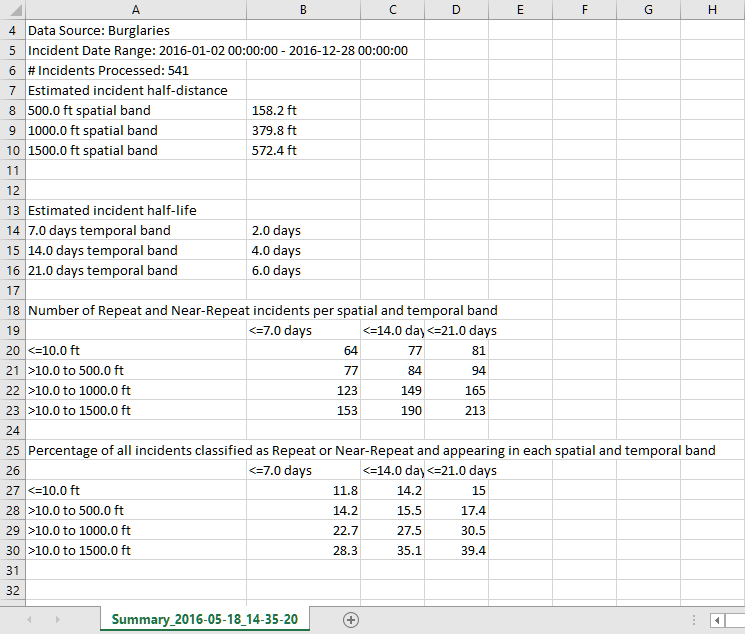
- Number of incidents in each space and time band. In the example data displayed below, 81 repeat incidents (those under 10ft. in distance) were observed in a 21 day time band, and 213 near repeats occurred within 1500 feet and 21 days.
-
Percentage to the total each number represents. In the example 15% of all incidents in the dataset occurred within 10 feet and 21 days of the original incidents. In addition, 39.4% of all incidents were a near repeat, occurring within 1500 ft. and 21 days of an originating incident.
In total, 54.4% of all incidents in the example data set were part of a repeat or near-repeat victimization pattern when we define near-repeat as within 21 days and 1500ft. This high-proportion of repeat and near-repeats phenomena suggests that an operational strategy based on patrolling in these high-risk areas would be an efficient use of resources.
Repeat and Near Repeat Incident Summary report