An ArcGIS Pro project can be used to visualize space and time patterns using the results of Repeat and Near Repeat Analysis. A 2D view can reveal spatial relationships between originator and near repeat crimes while a 3D view can reveal relationships between originator and repeat incidents by displaying time on the vertical Z axis. Side by side comparison of both views provides a clearer picture of this relationship.
To create a new project for visualizing space and time patterns in incident data, complete the following steps:
- Start ArcGIS Pro and import the Burglaries map.
- Create a new scene and if necessary dock the Scene tab to the right of the Layers tab, so the 2D view is on the left and the 3D scene is on the right.
- On the Map tab, in the Layer group, click the Basemap drop-down and choose Light Gray Canvas.
- Click on the 2D view (Layers tab) and drag the Burglaries and Connections layers to the 3D scene (Scene tab).
- In the Contents pane drag the Burglaries layer from the 2D Layer category up to the 3D Layer category so they will appear correctly.
- Symbolize the Burglaries layer using unique values and one value field (s1000t7).
- In the table click on the Originator symbol and browse to the ArcGIS 3D symbols, then choose the sphere symbol.
- Under Format Polygon Symbol, click Properties and change the size to 8 pt, then click Apply.
- Repeat steps 7 and 8 to symbolize Repeat and Near Repeat features with different colors.
- Right-click on the Burglaries layer to open the Layer Properties dialog box.
- Click on Elevation and set the elevation type to Feature are At an absolute height, then click on A field and choose the ZVALUE field from the list.
- Change the Vertical Exaggeration to 25 and click OK.
- Turn on labels on the Burglaries layer and in the Label Class pane the change to Expression to [OFFENDATE].
- Click Symbol and change the size and position to make the labels more readable, then click Apply.
- Right-click on the Connections layer to open the Layer Properties dialog box.
- Click on Elevation and set the Vertical Exaggeration to 25, and then click OK.
- Zoom into an area with connections between the originator and repeat or near Repeat crimes in both views.
-
In the 3D view hold down the Shift key and use the right mouse button to tilt the view. As you tilt and zoom in you will begin to see repeat burglaries stacked above the originator incident.
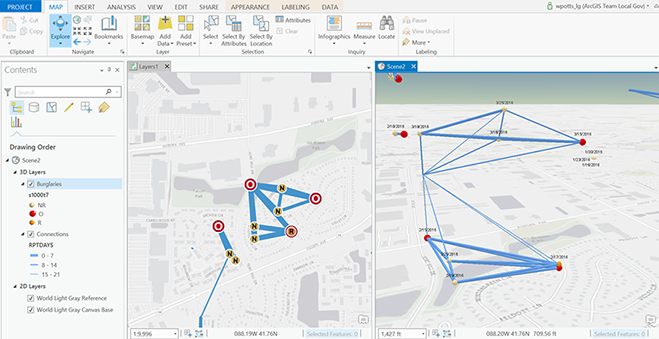
In the image above you'll see the 2D view on the left and 3D view on the right. The 3D view reveals two burglaries at the same location one day apart. - Save the project.