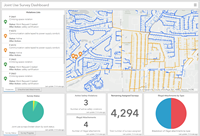
The Joint Use Survey Dashboard can be used by operations managers to view the status of joint use surveys, unauthorized attachments, and safety violations reported in the field.
To configure the dashboard, create a dashboard in ArcGIS Online or Portal for ArcGIS. You can then configure the dashboard elements for your joint use field operations.
Create a dashboard
- Verify that you are signed in to your organization with privileges to create content.
- Click the Apps button in the header of your site.
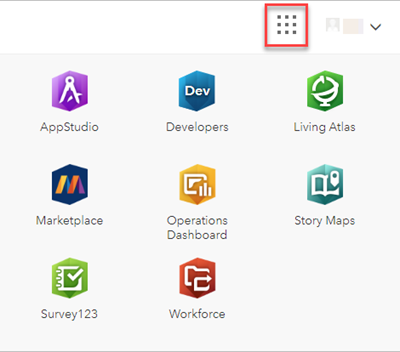
- Select the Operations Dashboard app.
- Click Create Dashboard.
- Provide a title for your dashboard.
- Optionally specify search tags, a summary, and a target folder.
- Click Create Dashboard.
Add a map
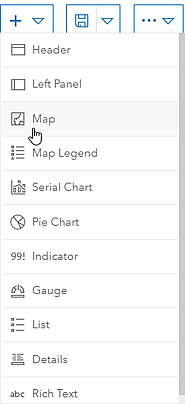
- Click the Add button.
- Select Map from the menu.
- Search for Joint Use Survey Manager and select the map.
- Specify any settings for the map and click Done.
Remaining assigned surveys indicator
To configure an indicator of assigned surveys remaining, complete the following steps:
- Add an indicator element and select the Joint Use Survey layer as the data source.
- Configure the data tab settings:
- Filter: Survey Status equal Assigned
- Statistic: Count
- Configure the general tab settings:
- Title: Remaining Assigned Surveys
- Description: Total number of surveys assigned
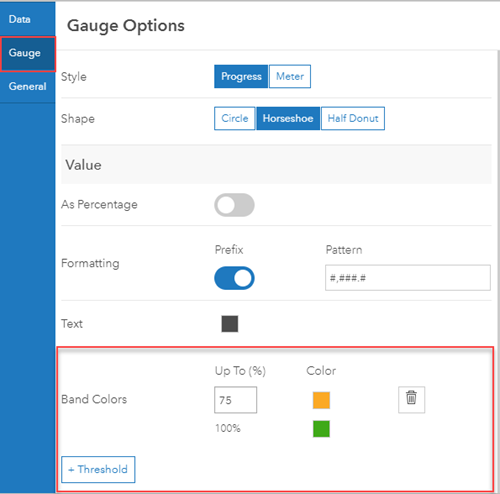
Joint use survey gauge
To configure a gauge element of completed joint use surveys, complete the following steps:
- Add a gauge element and select the Joint Use Surveys layer as the data source.
- Configure the data tab settings:
- Filter: Survey Status equal Completed
- Statistic: Count
- Maximum Value: 5000
- Configure the target range for the total number of poles at your utility to be surveyed and include a threshold value.
- Configure the general tab settings:
- Title: Survey Progress
- Description: The current progress of the joint use surveys
Survey status pie chart
To configure a pie chart element showing the status of joint use surveys, complete the following steps:
- Add a new pie chart element and select the Joint Use Surveys layer as the data source.
- Configure the data tab settings:
- Categories From: Grouped Values
- Categories Field: Survey Status
- Statistic: Count
- Configure the appearance of the pie chart, including color ramp and labels in the chart and slice tabs.
- Configure the general tab settings:
- Title: Survey Status
- Description: Joint use surveys broken down by work status.
Active violations indicator
To configure a indicator element with the total number of active safety violations, complete the following steps:
- Add an indicator element and select the Violations layer as the data source.
- Configure the filter to show active violations.
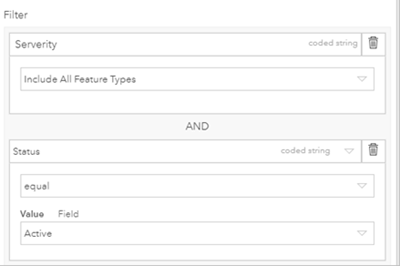
- Configure the general tab settings:
- Statistic: Count
- Title: Active Safety Violations
- Description: Number of active safety violations
Violations list
To configure a list element with all reported violations, complete the following steps:
- Add a list element and select the Violations layer as the data source.
- Update the data tab properties to sort the list with newest appearing at the top.
- Configure the list tab settings:
-
Line Item Text:
                       {POLEID}
                       {VIOLATIONTYPE}

                       Status: {STATUS}
                       After Action: {REQACTION}
-
- Configure the general tab settings:
- Title: Violations
- Description: List of most recently reported safety violations
- Update Actions to include the Show pop-up and Zoom to tools.
Illegal attachments indicator
To configure an indicator element with the total number of illegal attachments, complete the following steps:
- Add an indicator element and select the Attachments table as the data source.
- Configure the filter to show active illegal attachments.
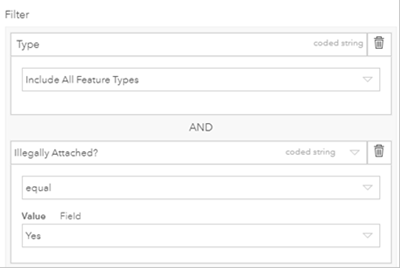
- Configure the general tab settings:
- Title: Illegal Attachments
- Description: Number of illegal attachments
- Display Type: Count
Illegal attachments by type
To configure a pie chart element with illegal attachments by type, complete the following steps:
- Add a pie chart element and select the Attachments table as the data source.
- Configure the data tab settings:
- Categories From: Grouped Values
- Category Field: Type
- Display Type: Count
- Configure the appearance of the pie chart, including color ramp and labels in the chart and slice tabs.
- Configure the general tab settings:
- Title: Illegal Attachments by Type
- Description: Breakdown of illegal attachments by type
Illegal attachments list element
To configure a list element with all unauthorized attachments, complete the following steps:
- Add a list element and select the Attachments layer as the data source.
- Configure the filter to show unauthorized attachments.
- Configure the list tab settings:
-
Line Item Text:
                           {POLEID}

                           Type: {Type}
                           Date: {DATERECORDED}
                           Owner: {OWNER}
-
- Configure the general tab settings:
- Title: Unauthorized Attachments
- Description: List of most recently reported unauthorized attachments
Save the dashboard
- Save the dashboard and edit the item details:
- Name: Joint Use Survey
- Summary: A dashboard to monitor joint use surveys.
- Description: Use this dashboard to view the results of joint use surveys in your service area. This dashboard includes elements to better understand the status of surveys, illegal attachments, and safety violations.
- Thumbnail: