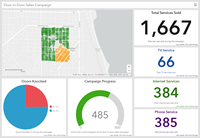
The Door to Door Sales Dashboard is a configuration of ArcGIS Dashboards. This dashboard provides marketing and sales managers a view of the door to door sales campaign status.
To configure a door to door sales dashboard, create a Dashboard in ArcGIS Online or Portal for ArcGIS. You can then configure the dashboard elements for your door to door sales campaign.
Create a dashboard
- Verify that you are signed in to your organization with privileges to create content.
- Click the Apps button in the header of your site.
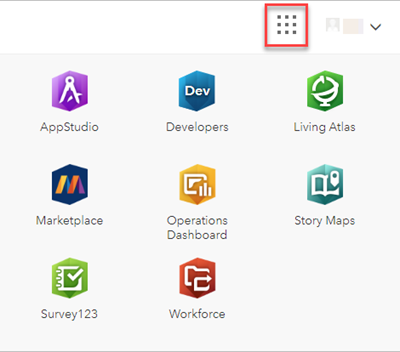
- Select the Operations Dashboard app.
- Click Create Dashboard.
- Provide a title for your dashboard.
- Optionally specify search tags, a summary, and a target folder.
- Click Create Dashboard.
Add a map
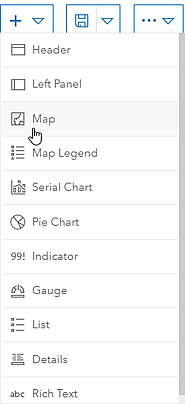
- Click the Add button.
- Select Map from the menu.
- Search for Door to Door Sales Campaign and select the map.
- Specify any settings for the map and click Done.
Total services sold indicator element
To configure the total services sold element, complete the following steps:
- Add a new indicator element and select the Customer Locations layer as the data source.
- Configure the data settings to view the sum of services sold.
- Value Type: Statistic
- Statistic: Sum
- Field: Total Customer Services
- Configure the general settings:
- Title: Total Services Sold
- Description: Total services sold during the campaign.
Campaign progress gauge element
To configure the campaign progress gauge element, complete the following steps:
- Add a new gauge element and select the Customer Locations layer as the data source.
- Configure the data settings to show the target range for the total number of prospective customers targeted in the campaign and include a threshold value.
- Filter: Door Knocked? equal Yes
- Statistic: Count
- Minimum Value: 0
- Maximum Value: 800
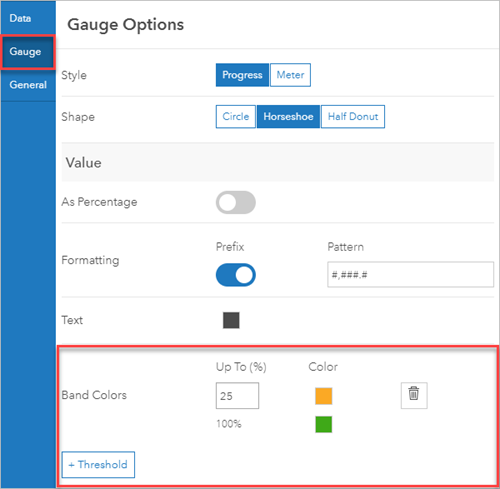
- Configure the gauge settings to show the threshold value.
- Configure the general settings:
- Title: Campaign Progress
- Description: Shows the current progress of the door to door sales campaign.
Doors knocked pie chart element
To configure a pie chart element for the number of doors knocked on, complete the following steps:
- Add a new pie chart element and select the Customer Locations layer as the data source.
- Configure the data settings for the doors knocked on during the campaign.
- Categories From: Grouped Values
- Category Field: Door Knocked?
- Statistic: Count
- Configure the appearance of the pie chart, including color ramp and labels in the Chart and Slice tabs.
- Configure the general settings:
- Title: Doors knocked
- Description: Doors knocked on during the campaign
Internet services indicator element
To configure the total Internet services sold element, complete the following steps:
- Add a indicator element and select the Customer Locations layer as the data source.
- Configure the data settings for total internet services sold.
- Filter: Is Internet Customer? equal Yes
- Statistic: Count
- Configure the general settings:
- Title: Internet Service
- Description: Total Internet services sold
Phone services indicator element
To configure the total phone services sold element, complete the following steps:
- Add a indicator element and select the Customer Locations layer as the data source.
- Configure the data settings for total phone services sold.
- Filter: Is Phone Customer? equal Yes
- Statistic: Count
- Configure the general settings:
- Title: Phone Service
- Description: Total phone services sold
TV services indicator element
To configure the total TV services sold element, complete the following steps:
- Add a indicator element and select the Customer Locations layer as the data source.
- Configure the data settings for total TV services sold.
- Filter: Is TV Customer? equal Yes
- Statistic: Count
- Configure the general settings:
- Title: TV Service
- Description: Total TV services sold
Save the dashboard
- Save the Door to Door Sales dashboard and update the dashboard information:
- Name: Door to Door Sales Campaign
- Thumbnail image:
- Summary: Dashboard to view the progress of the current door to door sales campaign.
- Share the Door to Door Sales Dashboard with your ArcGIS organization's Sale and Marketing groups.